Samsung Galaxy S II T-Mobile USA

Roll over image to zoom in
Best Samsung Galaxy S II T-Mobile USA Amazon.com Deals for Tuesday 28th of July 2026

Samsung Galaxy Note II N7100 16GB Gray-Unlocked International Phone...
$129.00
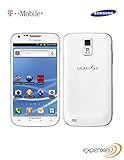
Samsung SGH-T989 Galaxy S II 16GB White Android Phone - T-Mobile...
Best Samsung Galaxy S II T-Mobile USA Ebay.com Deals for Tuesday 28th of July 2026
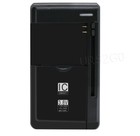
Universal Battery External Charger For T-Mobile Samsung Galaxy S II SGH-T989 USA...
$22.65

Portable Universal External Battery Charger for Samsung Galaxy S II SGH-T989 USA...
$15.63

[2-Pack] ArmorSuit MilitaryShield Samsung Galaxy S2 TMobile Screen Protector...
$8.99

ArmorSuit Samsung Galaxy S2 TMobile Screen Protector + Full Body Skin Protector...
$17.45

Long Lifespan 2x 6500mAh Battery Charger for Samsung Galaxy Note II SGH-T889 USA...
$46.74

High Quality 2x 6500mAh Battery Charger for Samsung Galaxy Note II SGH-T889 USA...
$46.91

Sporting 6500mAh Battery f Samsung Galaxy Note II T889 i605 R950 L900 EB595675LZ...
$20.88

Samsung Galaxy Note 2 N7100 4G LTE 16GB Android Smartphone Excellent Condition...
$39.87

Portable Single SIM Card Tray Holder for Samsung Galaxy Z Flip 3 5G SM-F711U USA...
$19.3

Long Life 3150mAh Battery Charger for T-Mobile Samsung Galaxy S II SGH-T989 USA...
$35.3

3150mAh Replacement Li-ion Battery for T-Mobile Samsung Galaxy S II SGH-T989 USA...
$16.65
Design
| Display Options | Samsung Galaxy S II T-Mobile USA vs average Samsung display options comparison | Difference in units | Difference in % | Samsung Galaxy S II T-Mobile USA | Difference in % | Difference in units | Samsung Galaxy S II T-Mobile USA vs average smartphone display options comparison |
|---|---|---|---|---|---|---|---|
| Resolution | 384000 px vs 1327789.3 px | 943789.33 px lower resolution | -71.1% | 384000 px | -71.2% | 950746.99 px smaller resolution | 384000 px vs 1334747 px |
| Pixel Density | 218 ppi vs 314 ppi | 95.99 ppi lower pixel density | -30.6% | 218 ppi | -31.6% | 100.8 ppi lower pixel density | 218 ppi vs 318.8 ppi |
| Screen Size | 4.52 " vs 5 " | 0.44 " smaller screen size | -8.8% | 4.52 " | -11.1% | 0.57 " smaller | 4.52 " vs 5.1 " |
| Touch Screen | YES vs 100% YES | YES | YES vs 98.8% YES | ||||
| LCD Displays 3 Subpixels per Pixel | YES vs 58.7% YES | YES | YES vs 89.8% YES | ||||
| Summary | |||||||
Features
| Networks Connectivity | Samsung Galaxy S II T-Mobile USA vs average Samsung Networks connectivity features comparison | Difference in units | Difference in % | Samsung Galaxy S II T-Mobile USA | Difference in % | Difference in units | Samsung Galaxy S II T-Mobile USA vs average smartphone Networks connectivity features comparison |
|---|---|---|---|---|---|---|---|
| Supports Cellular Networks | YES vs 100% YES | YES | YES vs 99.9% YES | ||||
| GPS Navigation | YES vs 99.1% YES | YES | YES vs 98.7% YES | ||||
| Supports WiFi Connections | YES vs 100% YES | YES | YES vs 99.4% YES | ||||
| Supports NFC Connections | YES vs 74.3% YES | YES | YES vs 54.9% YES | ||||
| Hotspot Wireless Sharing | YES vs 100% YES | YES | YES vs 99.9% YES | ||||
| 802.11n WiFi Connections | YES vs 100% YES | YES | YES vs 99.8% YES | ||||
| Summary | |||||||
Capacity
| Model Benchmarks | Samsung Galaxy S II T-Mobile USA vs average Samsung Benchmarks performance comparison | Difference in units | Difference in % | Samsung Galaxy S II T-Mobile USA | Difference in % | Difference in units | Samsung Galaxy S II T-Mobile USA vs average smartphone Benchmarks performance comparison |
|---|---|---|---|---|---|---|---|
| Head SAR (US) Radio Frequency Absorption Rate | 0.16 W/kg vs 0.6 W/kg | 0.46 W/kg lower Head radio frequency energy absorption rate (US) | -74% | 0.16 W/kg | -80.2% | 0.65 W/kg lower Head radio frequency energy absorption rate (US) | 0.16 W/kg vs 0.8 W/kg |
| Head SAR (EU) Radio Frequency Absorption Rate | 0.34 W/kg vs 0.5 W/kg | 0.11 W/kg lower Head radio frequency energy absorption rate (EU) | -24.5% | 0.34 W/kg | -50.5% | 0.35 W/kg lower Head radio frequency energy absorption rate (EU) | 0.16 W/kg vs 0.8 W/kg |
| Body SAR (US) Radio Frequency Absorption Rate | 0.96 W/kg vs 1 W/kg | 0.02 W/kg lower Body radio frequency energy absorption rate (US) | -2.5% | 0.96 W/kg | +2.6% | 0.02 W/kg higher Body radio frequency energy absorption rate (US) | 0.96 W/kg vs 0.9 W/kg |
| Summary | |||||||


Reviews
There are no reviews yet.